State Transistion Model - Reading Guide

|
Project:
|
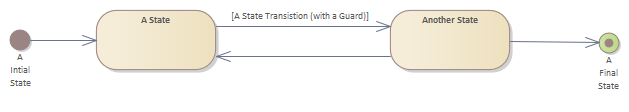
State Transistion Model - Reading Guide : StateMachine diagram
A <font color="#2e8b57"><b>State Transition Diagram</b></font>, also known as a state machine diagram, is a type of diagram used in computer science and related fields to describe the behavior of systems. It is a graphical representation of the states that an object or system can have, as well as the transitions between those states. State transition diagrams are commonly used in the design and analysis of software systems, as they provide a visual way to understand and communicate how a system responds to events and changes its state.<br/><br/>A state transition diagram consists of the following components:<br/><ol>
<li>States: States represent the different conditions or modes that a system can be in. They are typically depicted as circles or rounded rectangles in the diagram. Each state represents a specific configuration or behavior of the system.</li><li>Transitions: Transitions depict the change of state that occurs when a certain event or condition is triggered. They are represented by arrows connecting the states in the diagram. Transitions may have associated conditions or actions that need to be satisfied or performed for the transition to occur.</li><li>Events: Events are the stimuli or triggers that initiate a state transition. They represent external or internal occurrences that cause the system to change its state. Examples of events can include user inputs, timer expirations, or system signals.</li><li>Actions: Actions are the operations or behaviors that are performed when a state transition occurs. They represent the activities or tasks that are executed as a result of a particular event or transition. Actions can include computations, updates to system variables, or interactions with other components.</li></ol> <b><i>Purpose of a State Transition Diagram</i></b><br/>State transition diagrams serve several purposes in system design and analysis:<br/><ol> <li>Behavioral Modeling: They provide a visual representation of how a system behaves over time. By showing the different states and transitions, state transition diagrams help designers and stakeholders understand the dynamic aspects of a system and how it responds to different events.</li><li>Requirements Analysis: State transition diagrams can be used to capture and analyze the requirements of a system. They help identify the possible states that a system can be in, the events that can occur, and the transitions between states. This analysis can help uncover missing or incomplete requirements, as well as potential design flaws.</li><li>System Design: State transition diagrams can be used to design the control logic of a system. They help specify the conditions under which state transitions occur and the actions that are performed during those transitions. This design can then be implemented in software or hardware to create the desired system behavior.</li><li>Documentation and Communication: State transition diagrams provide a visual and intuitive way to document and communicate the behavior of a system. They can be used to explain the system's functionality to stakeholders, developers, or users, and can serve as a reference during system maintenance or troubleshooting.</li></ol><p/> |


